Category: Classroom Teaching
Infographic: Active Learning Tech Tools for Remote Teaching
Here are the top 10 tech tools to use in your classroom to promote active learning.
Mar 25, 2022

Infographic: How to Create Discussion Opportunities
Here are some tips by Dr. Analisa McMillan to make sure you facilitate an impactful discussion that showcases your students’ critical thinking skills.
Mar 24, 2022

How to Make Your Teaching More Engaging
An Advice Guide from the Chronicle of Higher Education By Sarah Rose Cavanagh Consider a student in an introductory math class — let’s call him Alex. Alex had some unpleasant experiences with math in high school. When he got to college, he tested into a math course below the level that would count toward his […]
Jan 13, 2021

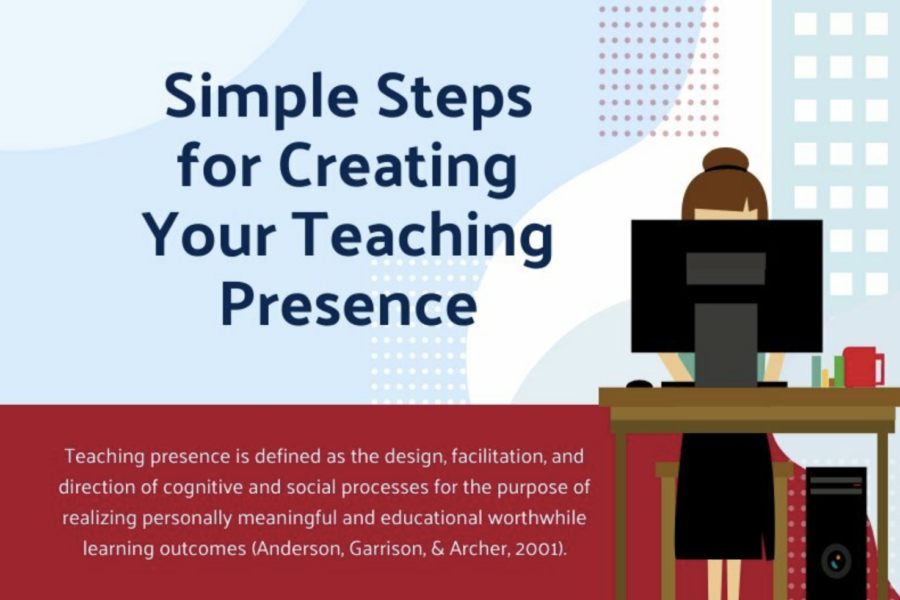
Infographic: Simple Steps for Creating Your Teaching Presence!
Are you ready to add more teaching presence to your courses using the design, facilitation, and direct instruction? The following infographic shares 11 simple steps to get you started! Download and view the infographic here
Aug 27, 2020
Infographic: Pandemic Teaching- Remote Learning
Are you ready for the possibility of remote teaching? Do you want to try something different than spending 3 hours lecturing your students live and not knowing if your students are actively engaged? A blended or flipped remote classroom approach benefits you and your students by creating a learning environment that is engaging and allows for optimal […]
Jun 23, 2020


Infographic: Pandemic Teaching – Social Distancing on Campus
We are heading back to campus this fall, and you may be looking for alternative ways to decrease your class size or time spent on campus. Consider utilizing a blended or flipped approach for your fall courses as alternatives to the traditional in-person course. View and download this infographic.
Jun 11, 2020

Infographic: Let Your Data Speak for Itself – Data Visualization Tips for Success
Data visualization is the graphical representation of information. It reduces large, complicated chucks of data into easily digestible visuals. Data visualization also allows you to comprehend information rapidly and easily find trends, patterns, and outliers. In addition, visualized data can hold audience interest longer, promote engagement and increase the retention of key concepts. Design for […]
Mar 11, 2020

THRIVE: Success strategies for the modern-day faculty member
A new resource is available to help faculty succeed! THRIVE is a collection of more than 50 ideas for fast, focused professional development, created by experts across UNMC — the people who walk in your shoes. One- to two-page briefs were designed to be absorbed and implemented immediately in your work as an educator, clinician, […]
Oct 16, 2019

Infographic: Leveraging Social Media Using a #VisualAbstract to Disseminate Research
#VisualAbstracts are often shared on social media to summarize research in a short, pictographic format. The goal is to highlight key findings and attract readers to access the full article. Check out this infographic to see how easy it is to create your own #VisualAbstract (view a printable version of the infographic): >> Download a printable […]
Oct 4, 2019