Category: Faculty Development
How to Make Your Teaching More Engaging
An Advice Guide from the Chronicle of Higher Education By Sarah Rose Cavanagh Consider a student in an introductory math class — let’s call him Alex. Alex had some unpleasant experiences with math in high school. When he got to college, he tested into a math course below the level that would count toward his […]
Jan 13, 2021

Infographic: The SMART Way to Achieve Your Goals
The New Year is a perfect time to take stock of your career goals. If you find yourself year after year feeling disheartened about not achieving the goals set, there may be a flaw in your strategy. Use goals to achieve success Goal setting is often challenging and may take several attempts to establish. A […]
Dec 31, 2020

Infographic: 7 Ways Your Brain Can Stop You From Recruiting the Right Candidate
Whether or not you’re aware of it, you make thousands of decisions every day—around 35,000, to be exact. In any given moment, our brains are bombarded with tons of information that must be quickly processed, informing our decisions, both big and small. So, to keep up and be efficient, our brains take mental shortcuts. These […]
Dec 17, 2020

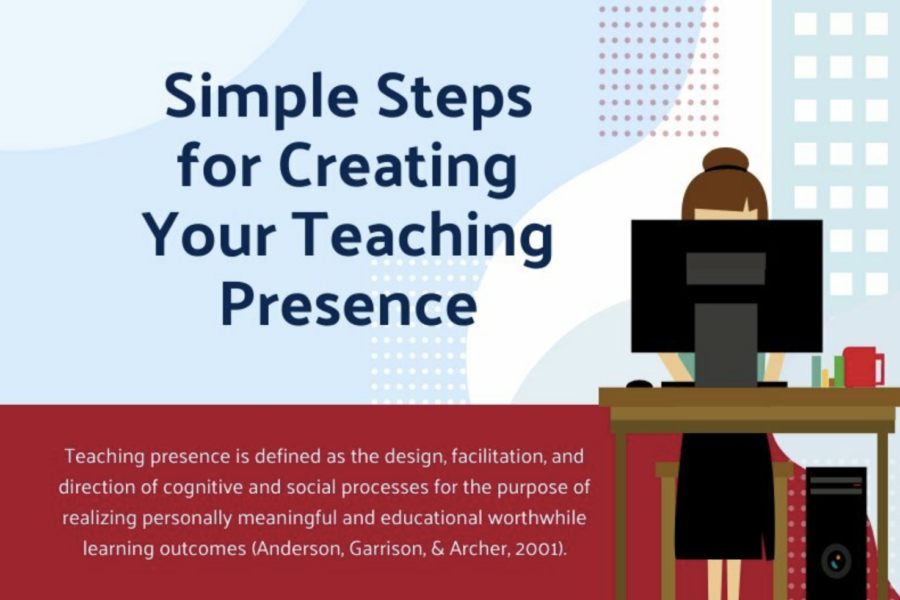
Infographic: Simple Steps for Creating Your Teaching Presence!
Are you ready to add more teaching presence to your courses using the design, facilitation, and direct instruction? The following infographic shares 11 simple steps to get you started! Download and view the infographic here
Aug 27, 2020

Infographic: Leading Beyond Your Level of Current Competence
Getting promoted usually brings to light a few areas in your job skills that need improvement. Here are three steps to excel in your new career.
Jun 24, 2020

Infographic: Let Your Data Speak for Itself – Data Visualization Tips for Success
Data visualization is the graphical representation of information. It reduces large, complicated chucks of data into easily digestible visuals. Data visualization also allows you to comprehend information rapidly and easily find trends, patterns, and outliers. In addition, visualized data can hold audience interest longer, promote engagement and increase the retention of key concepts. Design for […]
Mar 11, 2020

Infographic: Managing Multiple Generations in Today’s Environment
For the first time in human history, there are four generations regularly interacting, making our workplaces and educational spaces truly intergenerational. Based on varied formative experiences, generational preferences, and perspectives, each generation has their own set of expectations for professional interactions. Here’s a brief infographic to help explain each generations personality (view a printable version of […]
Dec 10, 2019

Infographic: Harness the Power of Design Thinking to Retool How You Solve Problems
Many of the changes and challenges facing modern day health care and its systems cannot be solved with strictly linear or analytical approaches. Health care professionals and leaders are required to exercise different kinds of thinking for better outcomes. >> Download a printable version of this infographic.
Nov 12, 2019

Infographic: Signs You’re on the Road to Experiencing the Imposter Phenomenon
High achievers radiate confidence. But lurking behind that self-assurance can be a feeling of inadequacy. Why? Because when you hold yourself to unrealistic or unsustainable standards, you leave yourself open to feeling like a fraud, or an imposter. If you answer “yes” to any of these questions, you may be on the road to experiencing […]
Nov 5, 2019

Infographic: How to Be a Supermentee
Having a mentor isn’t enough – you, the mentee, have to invest in the partnership to make sure you get the most out of it. Check out this infographic to see what a mentee’s role needs to be (view a printable version of this infographic). >> Download a printable version of this infographic.
Oct 22, 2019

Subscribe
Have questions or want to become a contributor? Email us.